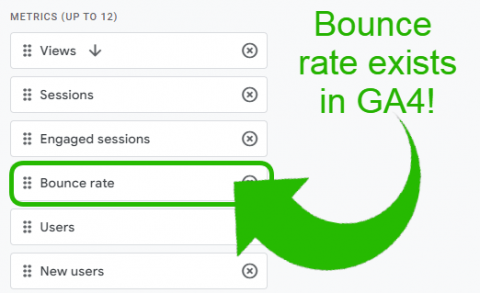
If you’re looking for the bounce rate metric in Google Analytics 4 (GA4,) then we have some good news and some bad news:
The good news: the bounce rate metric can now be accessed within GA4
The bad news: the definition of bounce rate has changed from what it was in Universal Google Analytics (UA) and you’ll need to now customise reports to see it
So, what do you need to know and where should you start? In this blog, we’ll explain everything you need to know.
How has the bounce rate metric changed from UA to GA4?
Although having the same name on both platforms, the bounce rate metric cannot be used for comparison as it is defined very differently:
- Universal Analytics bounce rate definition – the percentage of users who either didn’t view more than one page or didn’t trigger any goal conversion
- Google Analytics 4 bounce rate definition – the percentage of users who didn’t have an ‘engaged session’. Engaged sessions are triggered for users who spend more than 10 seconds on the website, trigger any conversion event, or visit more than one web page
Is bounce rate a valuable metric in Google Analytics?
A lot of well-respected marketers and analytics experts agree that the old UA bounce rate metric was a poor indicator of performance.
For example, a user may land on a website, watch a key video, absorb the content and even make contact via social media, but this session would be considered a bounce in Universal Analytics as only one webpage was ever viewed.
The bounce rate in Google Analytics 4 is a far more useful metric as it indicates how many users simply didn’t find what they were looking for and either quit their browser tab or, for example, pressed the back button to go back to a previous list of search results.
It’s really important to segment different sections of your website and different traffic sources before using the bounce rate metric or you could start basing key decisions on wishy-washy average statistics, which don’t account for:
- The difference between targeted paid traffic and broader reaching organic traffic
- The difference between main website landing pages, or for example, ‘how to’ pages where the user will get the information they need and leave immediately
- The difference between social or display campaigns which are shown to general audiences and search or shopping campaigns which are shown to people actively looking for something
- The difference between standard pages with many internal links and sales squeeze pages which force the user to perform one action alone
How do I view a bounce rate report in GA4?
To view the bounce rate metric, you must first create a landing page report in GA4 which, at the time of writing this blog, still isn’t one of the standard report templates.
-
- Find the ‘Pages and screens’ report from the ‘Engagement’ tab:
- Find the ‘Pages and screens’ report from the ‘Engagement’ tab:
2. Click the pencil icon to customise the report:
3. Before doing anything, save the report as a new report:
4. Name the report “Landing pages” and give it a description:
5. Go to the dimensions tab and add a new dimension of “Landing page” and set it as the default:
6. Make sure to apply the change, and then move on to the metrics data settings. Remove all the metrics shown and add just the metrics shown below:
7. You may wish to skip out the “Total revenue” metric if your website doesn’t deal with revenue metrics.
Please note that bounce rate in GA4 is the inverse of engagement rate, so you may not want both metrics on the report, as they go hand-in-hand and add up to 100%.
8. You can have one or two charts on any report like this. I prefer the bar chart alongside the line chart, but don’t be afraid to change these to suit your needs. To do this, just click the eye symbol to hide one of the charts:
9. Save changes to the current report to complete the landing page report.
10. The last step is to add it to the report navigation taxonomy by going to the report library link right at the bottom of the page:
11. Edit the “Life cycle” collection within the reports library, search for our new landing page report, and drag it into the “Engagement” topic area to add it to the navigation:
12. Have fun editing or adding other custom reports to Google Analytics 4 in the same fashion, especially if you’re very used to reporting within Universal Analytics.
Using the landing page report in GA4
After following the steps above, you can now view the landing page report quickly any time you use Google Analytics 4:
Segment out similar users, for example, just the users who came from organic search channels or users from a specific range of campaigns by using the comparison tool:
Set a large date range or system defined report sampling limits will limit the number of results.
Now all landing page metrics should be shown for your chosen segment:
Click any column to re-order or you can permanently set your preferred order in the report settings.
To see the exact number of any specific conversion event, use the dropdown on the conversion column to drill down:
Focus on the landing pages which have any of these issues:
- A high bounce rate
- A low number of conversions
- A low engagement time
- A low revenue amount (if applicable)
And finally…
GA4 will be a learning curve for many marketers. If you want someone to check you’re on the right path or if you’ve got any questions about GA4 bounce rate or any other metrics, feel free to speak to our team.
The post Where is the bounce rate in GA4? appeared first on Hallam.

